
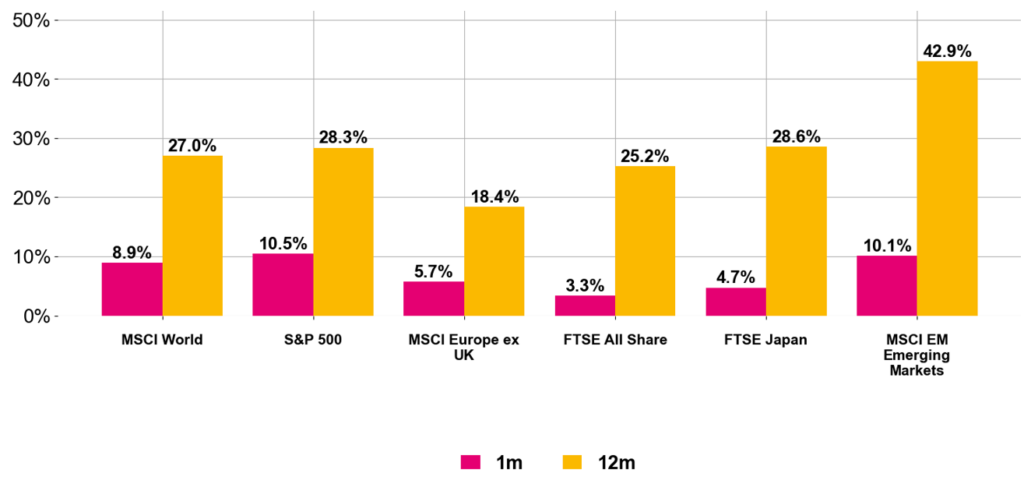
Following a challenging backdrop in March, global equities rebounded sharply last month as risk appetite strengthened and markets discounted ongoing geopolitical uncertainty. AI leadership reasserted itself after the technology sector experienced one of its weakest periods of relative performance in fifty years, with investors rotating back into hyperscalers and AI infrastructure.
This bolstered the tech-heavy U.S. market, which also benefited from its status as a net energy exporter – insulating it from the Iran conflict – and a robust earnings season where 84% of S&P 500 companies exceeded expectations. Internationally, returns were largely a function of technology concentration. This favoured Asia Pacific ex-Japan, which is home to companies such as TSMC and Samsung; meanwhile, UK equities underperformed, driven by the weak performance of the consumer staples and utilities sectors, which lagged as investors favoured growth over defensive assets.
Past performance is not necessarily a guide to future performance and is not guaranteed. Performance comparisons are included for illustration purposes only, there are no specific benchmarks.
Figure 1. Equity market returns (May 2026, Source: Pacific Asset Management)
Fixed income markets faced another challenging period as persistent hawkish central bank expectations kept government bond yields elevated through April. Policymakers broadly maintained their cautious stance, acknowledging that rising energy prices present upside risks to inflation and downside risks to economic growth. As a result, investors aggressively repriced the trajectory of monetary policy, with markets now factoring in potential rate hikes – a sharp reversal from the pre-conflict consensus of easing.
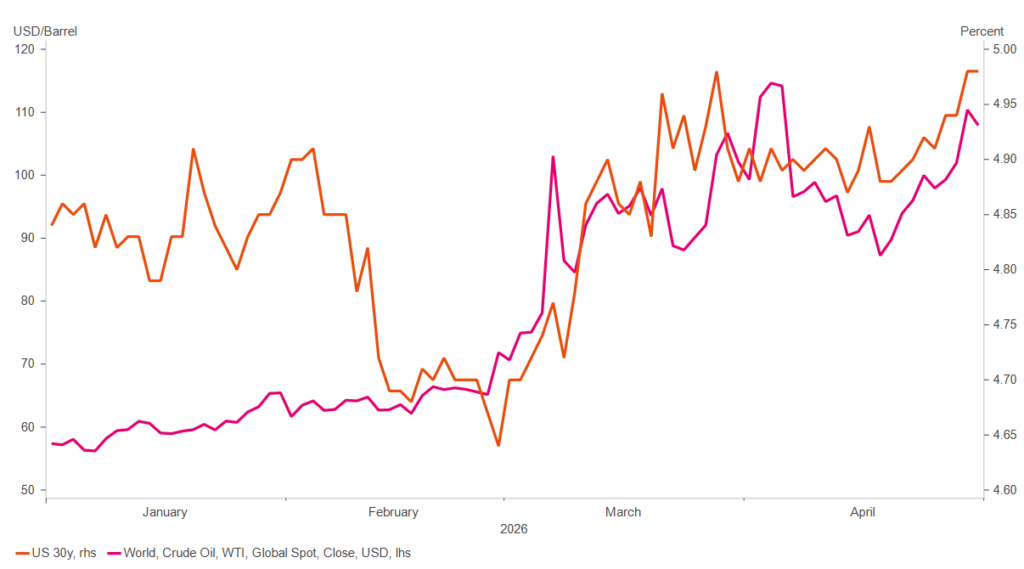
The path forward hinges on the duration of the Iran conflict; a protracted engagement increases the likelihood of a policy mistake, specifically the risk of raising rates into a weakening growth environment. While the fiscal profligacy of governments remains a structural headwind for bond markets, investors are increasingly pricing in higher inflation driven by energy costs. This can be seen in the US 30-year yield, which has moved in tandem with rising oil prices (see Figure 2.).
Past performance is not necessarily a guide to future performance and is not guaranteed. Performance comparisons are included for illustration purposes only, there are no specific benchmarks.
Figure 2. US 30yr yield and price of Crude Oil (May 2026, Source: Pacific Asset Management)
Oil & the 1970’s
As shown above, oil prices fluctuated significantly in April, retreating on ceasefire optimism before rebounding as negotiations reached an impasse. The disruption in the Strait of Hormuz has sharply tightened global supply, echoing the 1973 embargo and its legacy of entrenched inflation and stagnant growth.
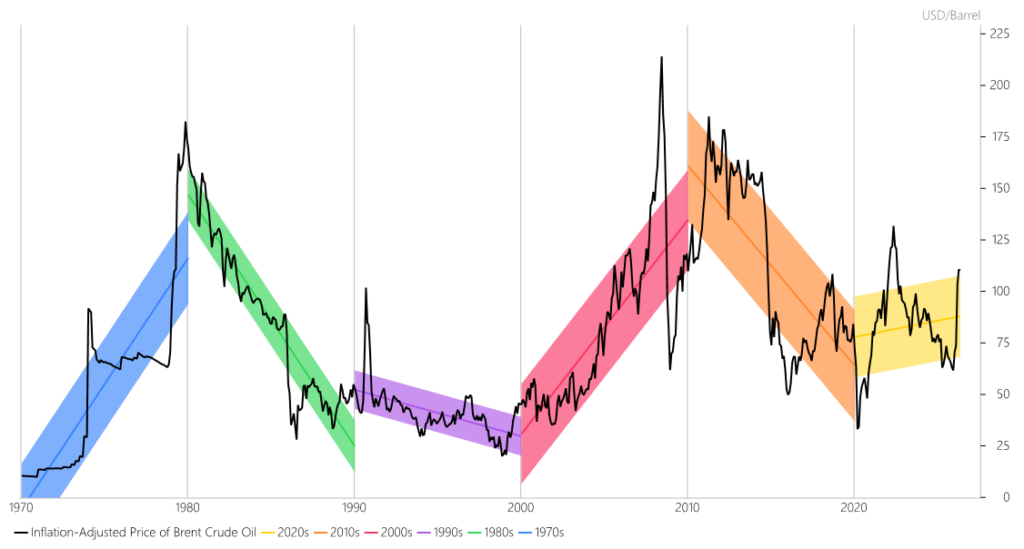
This surge threatens to permeate supply chains and household budgets by driving up transportation and industrial input costs. While the modern economy is structurally more resilient than in the past, the current price deviation from historical norms remains stark. Crucially, however, historical context is required: on an inflation-adjusted basis, oil would need to surpass $170 per barrel to match the true severity of the 1970s crisis (Figure 3).
Past performance is not necessarily a guide to future performance and is not guaranteed. Performance comparisons are included for illustration purposes only, there are no specific benchmarks.
Figure 3. Crude Oil Inflation-Adjusted Price Trends by Decade (May 2026, Source: Pacific Asset Management)
The impact of oil price volatility is rarely isolated to a single sector; rather, it permeates the entire global economic landscape. Because energy is a foundational input for a vast array of goods and services, price swings exert a pervasive influence – simultaneously stoking inflationary pressures and acting as a ‘tax’ that can stifle consumer demand. Furthermore, the relationship between oil prices and asset returns is inherently non-linear. While moderate price increases might occasionally reflect healthy global growth, sudden supply-side shocks can trigger abrupt shifts in corporate profitability and investor sentiment. This complexity makes portfolio construction particularly challenging, as the economic transmission of energy costs often moves faster than traditional market hedges can adjust.
The Inflation Tipping Point and Asset Correlation
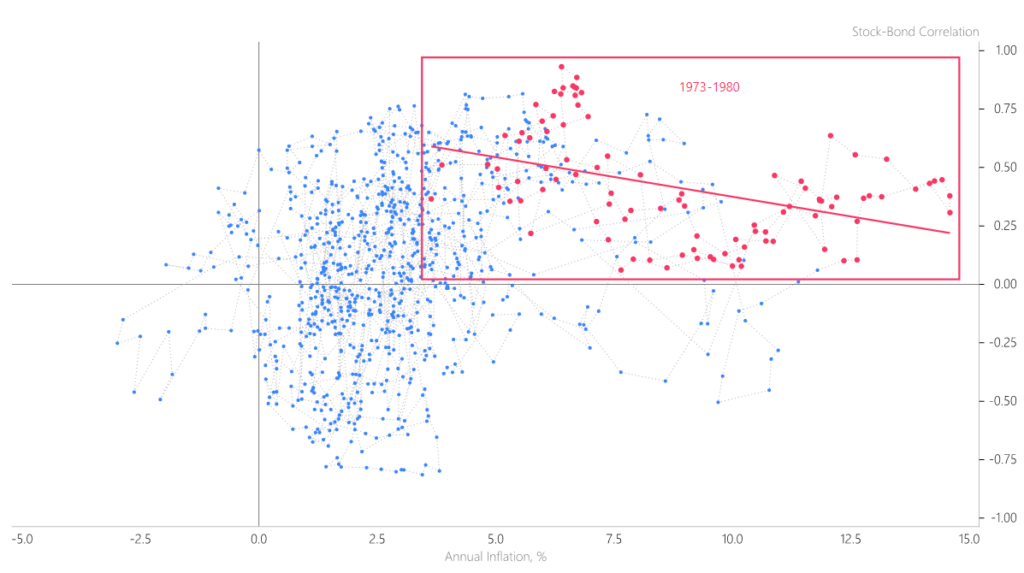
Historical market regimes demonstrate that the relationship between stocks and bonds is sensitive to the prevailing inflation environment. While there is no universal ‘magic number’, a clear shift typically occurs when inflation persists above the 2.5% to 3.0% range. Below this threshold, bonds often act as a reliable hedge against equity downturns, maintaining a negative correlation that protects portfolios. However, once inflation breaches this tipping point – as evidenced during the 1970s -the correlation frequently turns positive. In such environments, both asset classes tend to decline in tandem, as rising interest rates lead to higher yields as investors demand more compensation, causing bond prices to fall while simultaneously squeezing equity valuations. This shift effectively limits the portfolio of its traditional built-in protection.
Past performance is not necessarily a guide to future performance and is not guaranteed. Performance comparisons are included for illustration purposes only, there are no specific benchmarks.
Figure 4. US Equity-Bond correlation (May 2026, Source: Pacific Asset Management)
In the current environment of geopolitical instability and energy-driven inflation, the traditional static 60/40 portfolio is facing a significant structural test. When the negative correlation between stocks and bonds breaks down, a passive, ‘set-and-forget’ approach no longer provides the defensive cushion investors expect.
Ultimately, we believe investors will be rewarded for being proactive; by recognizing shifting market leadership and remaining agile, they can better capture emerging opportunities while navigating the complexities of this new market regime.